Select a region


What accounts for the majority of Jersey's greenhouse gas emissions? What impact have declining dairy cattle numbers had? What happens when the energy from France gets cut? And what has squirty cream got to do with anything?
According to estimates released last week, transport made up nearly half (44%) of the island's greenhouse gas emissions in 2019, with residential (21%) - ranging from fuel to personal care products - making up around a fifth.
The figures were collated by consultants Aether as part of a Government-commissioned 'Greenhouse Gas Inventory' providing estimates for historical emissions of greenhouse gases from 1990 until 2019.
The inventory's estimates show a marked change in balance across 29 years - whereas in 1990, both energy supply and transport both sat as equal emitters at 32%, this ratio has now shifted so that energy supply only contributes 12%.
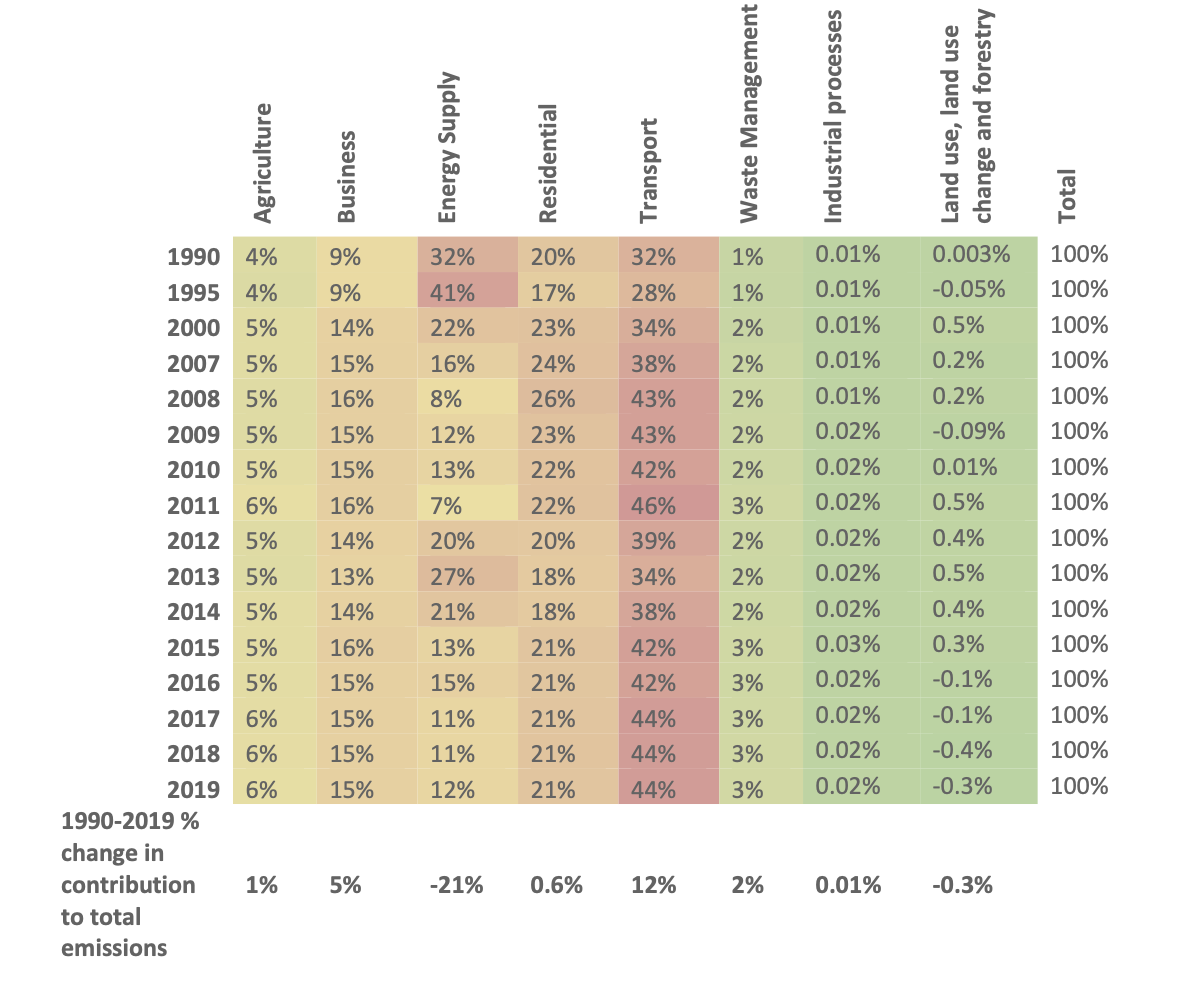
Pictured: There has been a 12% increase in the amount that transport contributes to climate emission ratio between 1990 and 2019.
Much of this energy shift is linked to the installation of the Normandie 2 Supply Cable in 2000, which allowed France to provide a majority of the island's energy.
Looking at the way change on the island has shaped its emission-rate, the report parallels an increase in population with an increase in emissions created from domestic wastewater treatment.
Here, Express analyses the inventory and its findings...
The inventory presents estimates of emissions of various greenhouse gases from a wide range of activities, which go on to be reported to the United Nations Framework Convention on Climate Change (UNFCCC).
Jersey's inventory is calculated separately, but ultimately forms part of the UK inventory, along with the other Overseas Territories and Crown Dependencies.
Decisions on what is and isn’t included in the inventory and how the data are reported are not made by the UK or Jersey, but by the UNFCCC.
Beyond being reported to the UNFCCC, the data itself can be used to inform policymaking and monitor progress in carbon reduction targets - Jersey is currently aiming for carbon neutrality by 2030 after declaring a climate emergency.
The inventory covers estimates on the six main greenhouse gases required for reporting under the Kyoto Protocol, namely: Methane (CH4), Carbon dioxide (CO2), Nitrous oxide (N2O), Hydrofluorocarbons (HFCs), Perfluorocarbons (PFCs), and Sulphur hexafluoride (SF6).
The inventory only estimates up to 2019, with each year's inventory having a two-year gap for official statistics to be available and to allow for time to then compile the data.
Estimated by measuring activity - such as the number of cows or tonnes of fuel used - and multiplying it by the factor of emission, the report gives its findings in tonnes of carbon dioxide equivalent (tCO2eq).
The largest estimated contributor to local transport emissions in 2019 were passenger cars, which accounted for 67,733 tonnes of CO2 equivalent.
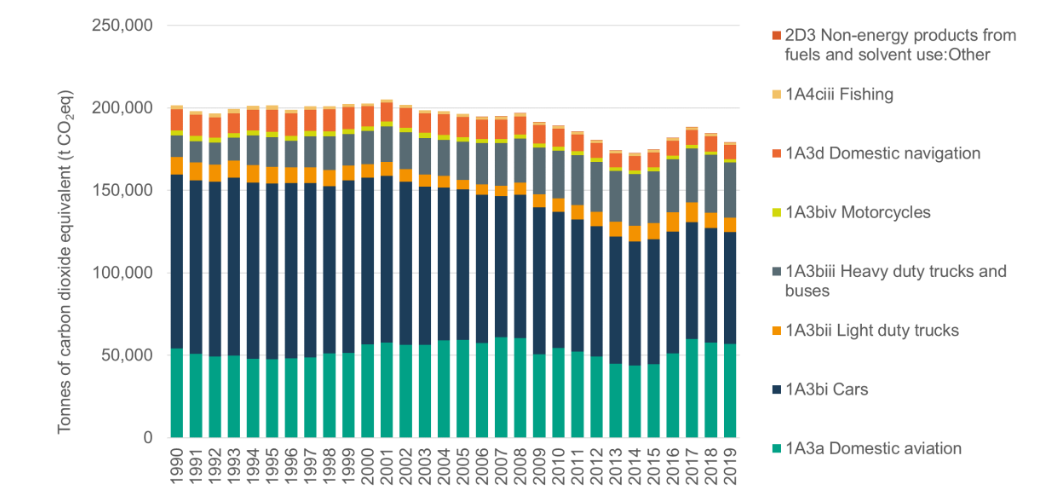
Pictured: Transport sector emissions by sub-sector 1990-2019.
The second largest contributor was domestic aviation, making up 67,733 tonnes of CO2 equivalent.
Together, aviation and passenger cars made up over half of the year's total emissions from transport.
While the inventory notes that estimates for passenger car emissions have decreased by 36% between 1990 and 2019, aviation has gone in the opposite direction, going up by 5% when compared with 1990.
Heavy duty buses were the only other area of transport to have increased in emissions between 1990 - 2019, having more than doubled from 13,092 tCO2eq to 33,292 tCO2eq during the timeframe.
The other contributors in 2019 were:
The residential category is made up of emissions from fuel combustion, metered dose inhalers - like personal care products (e.g. hair care, deodorant, shaving cream) and household products - as well as other aerosols.
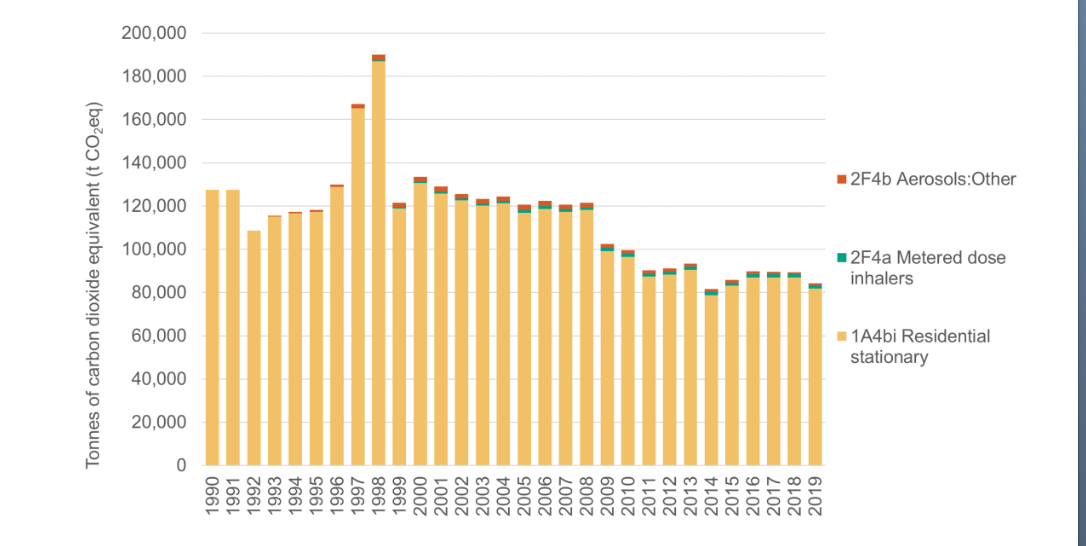
Pictured: Fuel combustion made up the majority of emissions in the residential sector.
The sector has seen a 34% decrease from 127,503 to 84,317 tCO2eq since 1990, something the report partly credits to "the uptake of electrical space heating and an associated switch from gas and oil to electricity."
Although emissions were increasing between 2014 and 2016 and "remained relatively constant from 2016 to 2018", there was a decrease of 6% between 2018 and 2019.
The business sector is separated into 13 different subsectors, including air conditioning, refrigeration, stationary combustion in commercial and institutional settings and other manufacturing industries.
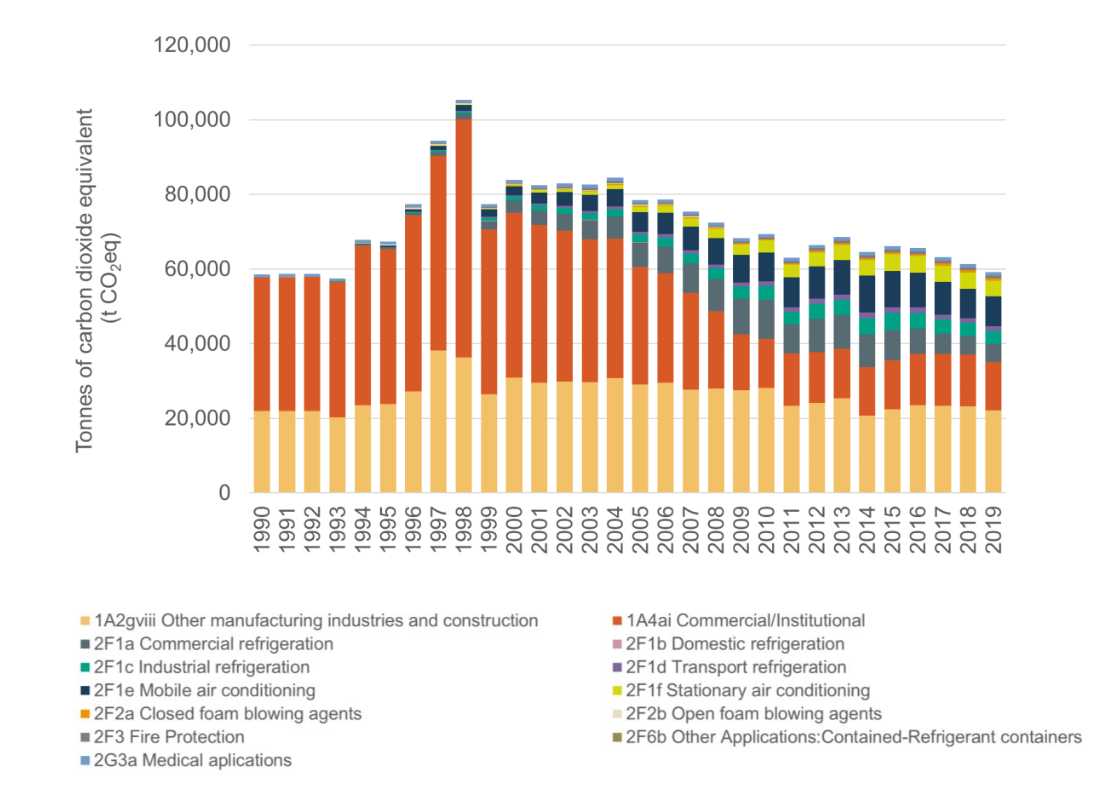
Pictured: In particular, kerosene used in commercial settings made up the most emissions from the business sector in 2019.
The highest of the subsectors and taking up over a third of the total was the use of kerosene in commercial settings, which counted for 22,189 tCO2eq.
Though its emissions have increased by 1% from 1990-2019, it saw a reduction of 3% between 2018 and 2019.
Estimated emissions from the island's energy supply have reduced significantly since 1990, going down by 77% from 204,199 tCO2eq to 46,758 tCO2eq.
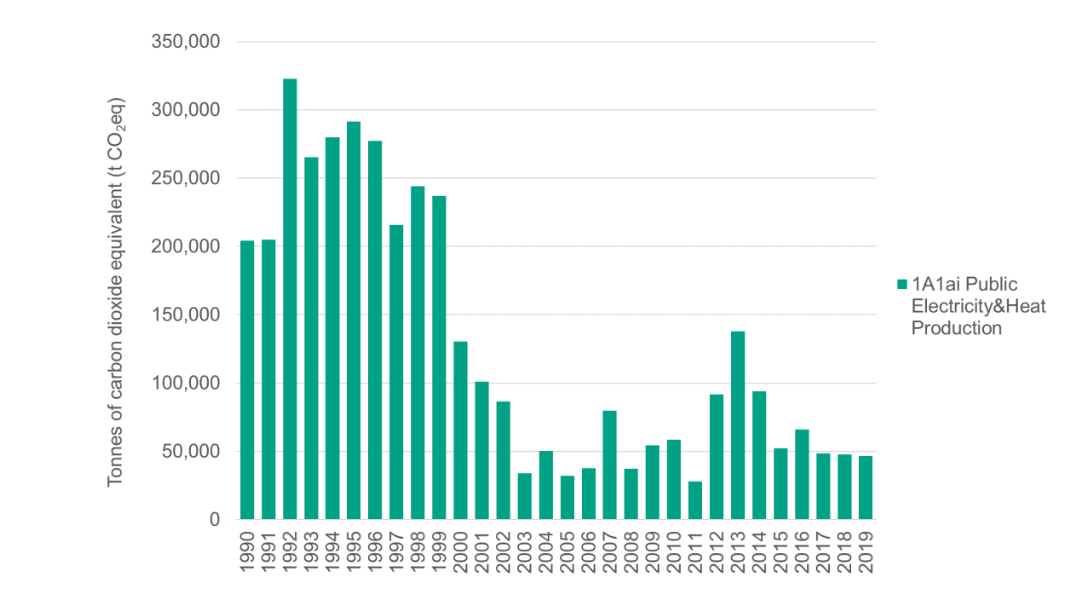
Pictured: Energy emission estimates have decreased dramatically since the installation of the 900MW, despite some spikes when it has failed to work.
Between 2018 and 2019 too, there was a 2% reduction.
Looking at the table, the report notes that these emissions reduced significantly when the 900MW Normandie 2 supply cable was installed in 2000, reducing the need for the diesel engine power plant.
This was further highlighted when in 2012 there was a sudden spike in emissions, as the failure of the cable meant electricity had to be generated on-island using gas turbines and diesel engines.
This continued until 2014, when the cable was repaired.
The report notes: "...Only around 2% of Jersey's energy supply was produced on-island in 2019, from the ERF and solar panels. The back-up power station at La Collette relies on the burning of two fuel types: heavy fuel oil and diesel."
The largest estimated agricultural emissions source in 2019 was from 'enteric fermentation' in dairy cattle - the digestive process that causes methane emissions.
Indeed, methane emissions accounted for 60% of agriculture's total emissions in the year.
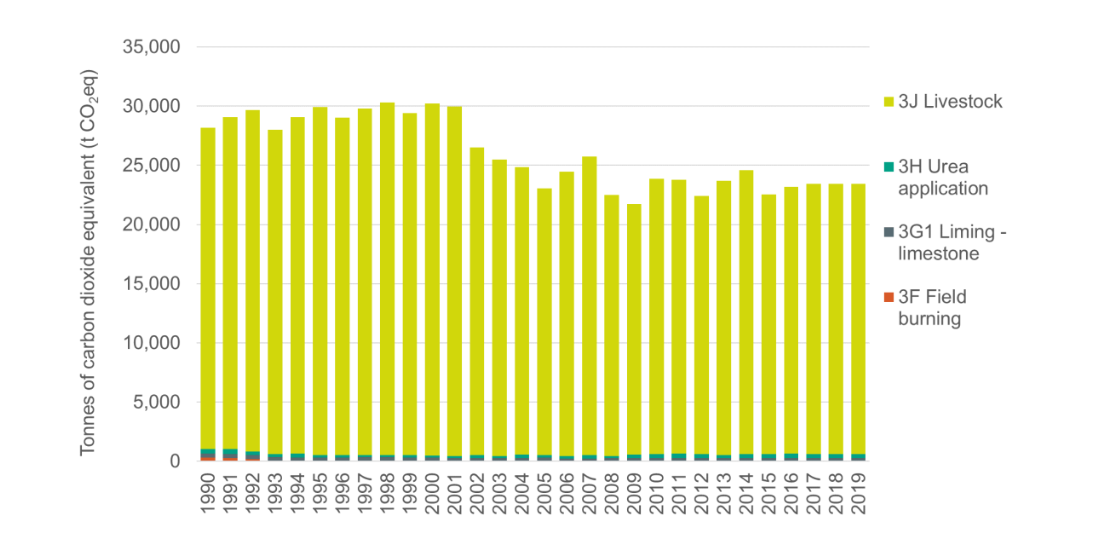
Pictured: Agriculture was made up predominantly of methane emissions from livestock.
The sector is split into four different subsectors: field burning, liming, urea application and livestock, with livestock making up by far the most emissions at 22,818 tCO2eq.
Emissions from the sector reduced by 17% from 1990-2019, which was put down largely to "declining numbers of dairy cattle" between 2000 and 2005.
However, there was a 0% shift between 2018 and 2019, with estimates remaining the same.
The waste management sector includes emissions from domestic wastewater treatment. Emissions generated by the Energy Recovery Facility (incineration of municipal solid waste) are accounted for under 'energy supply'.
Though waste management was proportionally smaller in emissions than other sectors, the significant increase it did have is indicative of wider societal change on the island.
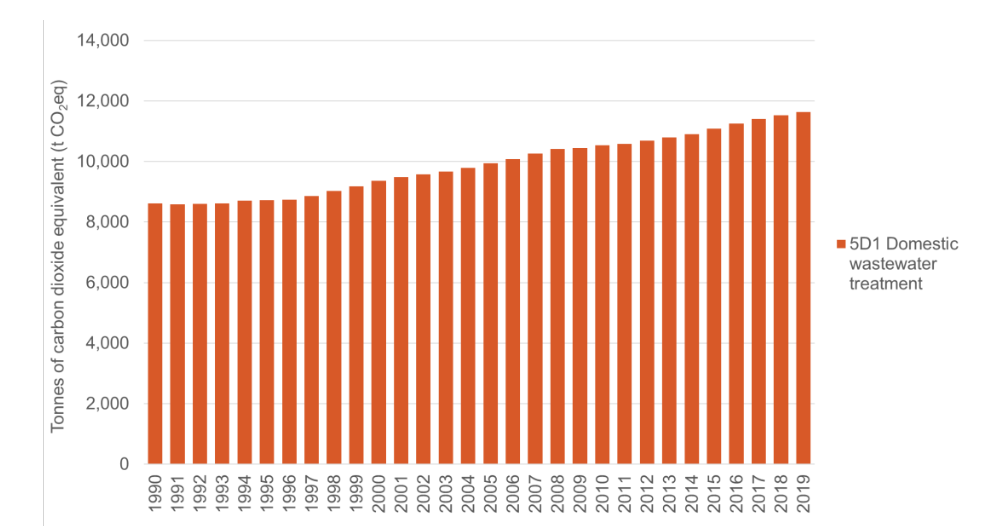
Pictured: The waste management estimate increase reflects Jersey's growing population.
While most sectors have decreased in their emission estimates, waste management emission estimates have gone up from 8,612 tCO2eq in 1990 to 11,635 tCO2eq in 2019 - a 35% shift.
Between 2018 and 2019, the figure climbed another 1%.
The report was clear that emissions had "increased as population has increased."
On the smallest scale of 2019's emissions, the report lists 0.02% as coming from the category of 'N2O from product use: Other'.
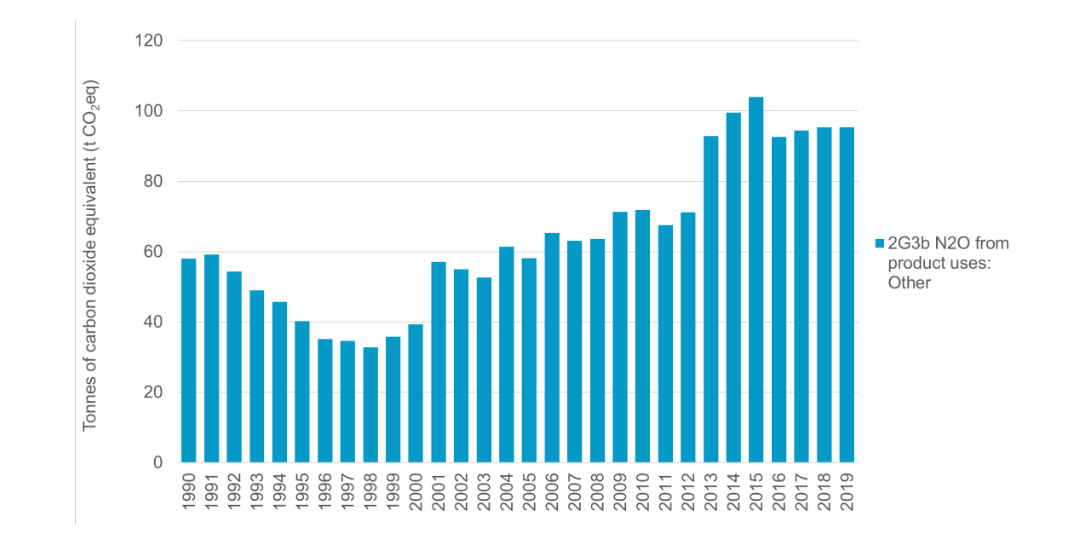
Pictured: The industrial process sector was entirely characterised by the use of squirty cream.
Breaking this down, it defines this as "emissions from the use of N2O [nitrous oxide, ed.] as a propellant in squirty cream", with product use and subsequently emissions increasing since 1990 by 65%, up to 95 tCO2eq.
Mitigating the impact is the land use change sector, which is actually reducing emissions.
The minus value is mostly attributed to cropland being converted to grassland, removing more CO2 from the atmosphere than the amount of greenhouse gases it has released.
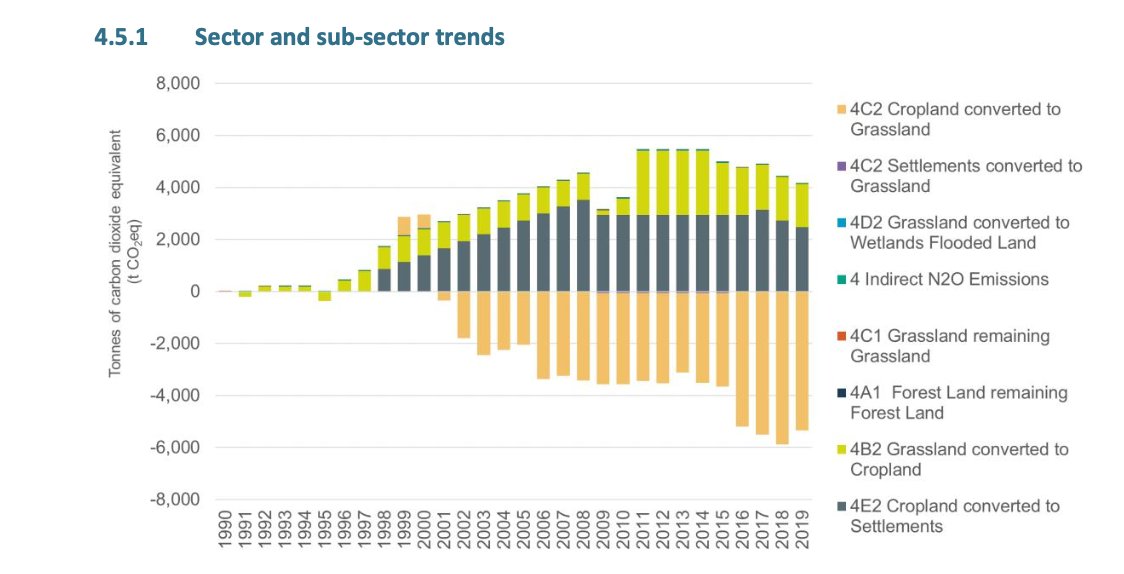
Pictured: Cropland converted to grassland has single handedly helped to balance and mitigate emission estimates from land use and change.
It is estimated that, in 2019, cropland to grassland sunk minus 5,340 tCO2eq, balancing out all the emissions caused from land changes such as cropland converted to settlements and grassland converted into cropland.


Comments
Comments on this story express the views of the commentator only, not Bailiwick Publishing. We are unable to guarantee the accuracy of any of those comments.