

Guernsey’s tax modelling has been given a hefty vote of confidence by the local firm brought in to check it.
Among the claims made are that Guernsey’s tax modelling is more “sophisticated” than the UK’s, that there wasn’t a single mistake made in the calculations, and that GST will comfortably raise more than £50m.
But buried inside that 62-page thumbs-up are some numbers that will make anyone trying to balance the States’ books sit up and take notice.
Dorey Financial Modelling says Guernsey’s full-population approach is more sophisticated than the UK’s sample-based system, and that its calculations are spot-on.
It also says GST could raise las little as £33.5m from local households under certain circumstances – £7.5m less than the States was publicly claiming only three days ago.
And there is one big red warning in the report.
So, what did we actually learn from P&R’s £10,000 validation exercise?
1. Guernsey’s tax model is, apparently, better than the UK’s
Let’s start with one piece of the report P&R will probably be shouting about.
Dorey says Guernsey’s Rolling Electronic Census gives the island a tax-modelling advantage that the UK simply does not have.
The Guernsey system continuously updates population data using administrative records and links it to tax and social security information.
The UK, by contrast, has no population register.
Its census is a questionnaire conducted every 10 years, while HM Revenue & Customs’ tax costings are based on samples.
Dorey says Guernsey’s approach is also ahead of the other Crown Dependencies and Gibraltar, where census information is still based on questionnaires and is not linked to tax records for modelling.
It puts the island’s system in the same broad family as the register-based approaches used in Nordic countries.
In Dorey’s words, the full-population approach is the “most sophisticated” of the three main ways of modelling consumption taxes.
That’s quite a claim for an island of 67,000 people.
2. The calculations check out – every single one
If P&R wants to defend the mechanics of its model, this is another piece of evidence it can point to.
Dorey rebuilt the calculation independently and ran it across all 66,021 individuals and 25,529 households in the model.
The result? The numbers matched.
Every calculated field agreed with the States’ model, right down to the pound.
That included the income tax, social security, health tax and GST calculations.
To prove the tax engine isn’t just spitting out theoretical guesswork, Dorey tested it against the island’s latest actual tax receipts.
When running the existing tax rules, the model’s total for combined income tax and social security landed within 1.4% of actual real-world collections.
The auditors say this proves the baseline math accurately mirrors what islanders actually earn and pay.
So, whatever arguments there may be about the assumptions going into the machine, Dorey found no arithmetic disaster lurking inside it.
3. P&R assumes tax collection is perfect
This is arguably the most important line in the whole report.
Dorey’s assurance dashboard contains 17 areas: Twelve are green, four are amber, and there is one red.
It’s not the maths, the census data, or the use of estimated incomes. It’s tax collection.
| Area | What Was Checked | Result |
|---|---|---|
| 🟢 Calculation Engine | Independent recomputation of income tax, contributions, health tax and GST for all 66,021 individuals and 25,529 households | Exact agreement, every field, every record |
| 🟢 Post-model Adjustment Factors | Owner-manager reclassification, Class 2 true-up, Alderney price factor | Reproduced to the pound; the owner-manager factors are the team’s professional judgement, reviewed and considered reasonable |
| 🟢 Income Tax and Contributions | 2026 rules replicated; each package measure costed through the recreation; owner-manager reclassification stress | Rules reproduced exactly; income tax and employer lines within £1m of the published costings; personal contributions £3m apart (owner-manager judgement) |
| 🟠 Population and Income Data | 2022 census snapshot uprated to 2026 | Standard practice; factors documented in the rebasing workbook, not audited against published indices; effect carried in the uncertainty range |
| 🟠 Expenditure Survey | 2018-19 survey replaced by 2023-24 mapping (published 27 July 2026) | Effect measured independently: about 8 per cent lower; mapping confirmed final by the team; small cells estimated by ratio |
| 🟢 Income Quintile Definition | Ranking on equivalised rather than unequivalised income | Corrected by the team; effect +4 per cent measured independently |
| 🟠 Exemption and Zero-rating Set | Package configuration that takes a uniform 3 per cent (£46.1m) to £38.3m | Set published and survey workbook supplied; the £7.8m step is taken as the residual to the published figure and bracketed by the external checks |
| 🟢 Visitor GST | £149m visitor spend less £35m zero-rated travel, revised to £3.5m | Sourced to the 2025-26 Visitor Expenditure Survey |
| 🟢 International Services Entity Fees | Entity counts by category times an assumed fee schedule | Reconciled: £12.1m upper estimate, £10.1m lower after a £2m provision, £11.0m carried as the midpoint |
| 🟢 Estimated Incomes | Incomes filled in where no record exists (12 per cent of income): do they resemble similar people, and how far does GST depend on them? | Sound: they match the recorded incomes of similar people; if all were 20 per cent wrong, GST would move 1.3 per cent |
| 🟢 Behavioural Response | Price elasticities applied in post-processing | Allowed for at £0.7m; proportionate at 3 per cent |
| 🔴 Compliance and Collection Gap | Registration threshold, under-declaration, off-island purchases | No allowance anywhere in the model or the published figures; 3 to 5 per cent is typical |
| 🟢 RPIX Effect of 1.9 per cent | Arithmetic of the rate on the share of the RPIX basket in the base (current weights) | Inside the defensible range of 1.5 to 2.5 per cent; not a model output; to refresh when the RPIX weights change in January 2027 |
| 🟢 External Reasonableness | Five simpler methods; model rescaled to Jersey | All bracket the figure; Jersey reproduced within 10 per cent |
| 🟢 Guernsey Economic Model | Is GEM or any descendant in the calculation chain? | No; the team have confirmed it is not used in the model or in any uprating factor |
| 🟠 Excel versus Power BI | Reconciliation of the two implementations | Excel model recomputed; Power BI build not reviewed, reconciled to it at aggregate level in the rebasing workbook |
| 🟢 Data Safeguards | Census Officers, secure environment, aggregates only | Complied with throughout; no personal data held by this firm |
The States’ published figures assume that all the GST due will actually be collected.
Dorey says that is not realistic. Typically you’d expect a “collection gap” of 3% to 5%.
For Guernsey’s household GST, that would mean another £1m to £2m disappearing from the expected receipts.
Dorey is careful to say this is not an error in P&R’s model, it’s a gap in what the published figures allow for.
But when you’re trying to close a multi-million-pound funding gap, that’s a fairly important distinction.
Given the States’ less-than-perfect track record on collecting tax, it’s a reasonable question to ask why the civil servants doing the modelling assumed there’d be no problems.
4. Household GST revenue has dropped up to £7.5m
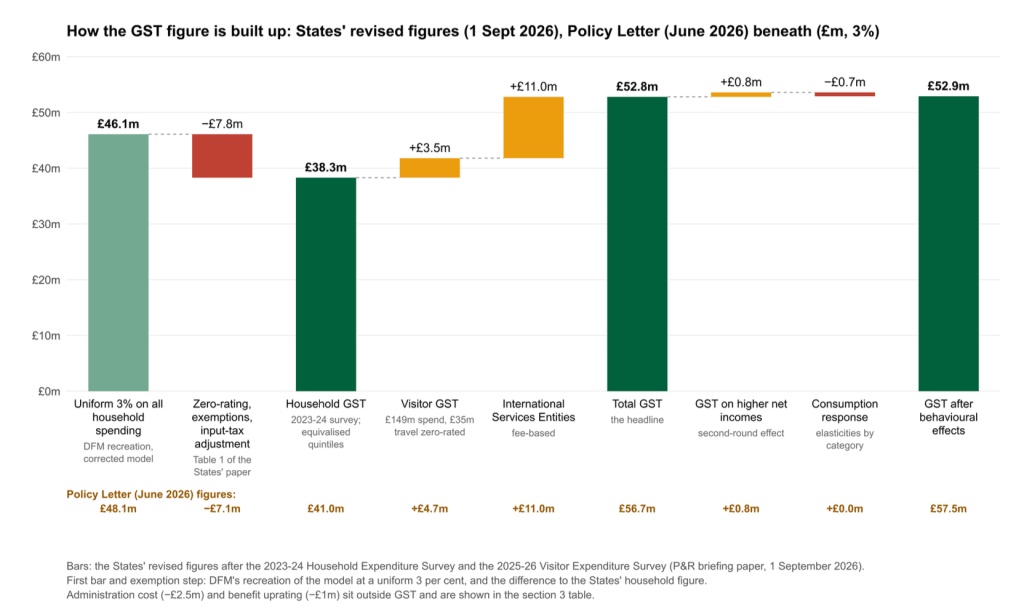
P&R’s modelling originally estimated GST would raise £41m from local households, based on seven-year-out-of-date spending figures, but this was revised down to £38.3m once it was remodelled using more up-to-date figures.
Dorey instead provided a range of between £36m and £41m around P&R’s revised £38.3m figure.
However, that estimate didn’t account for people spending less because of GST and didn’t budget for any non payment of tax.
Dorey remodelled, assuming people spend £700,000 less in total after GST and accounting for a 3% to 5% ‘collection gap’.
In that case, household GST could come in at about £33.5m, which Dorey describes as the “floor for planning”.
And that means the difference between the original £41m household GST figure – which P&R was publicly relying on as recently as Tuesday morning – and Dorey’s worst-case planning floor is £7.5m.
However, even this lower estimate assumes GST reduces spending by less than £1m.

5. Where’s P&R’s macroeconomic modelling?
Express has repeatedly asked P&R how the modelling was created, including what methodology it uses and what the formulas are.
However, we haven’t received answers to our question so we asked a leading tax modelling expert from the Institute for Fiscal Studies how tax modelling typically works.
Martin Mikloš told us governments typically use a combination of bottom-up ‘microsimulation’ along with ‘macroeconomic modelling’ to look at the wider economic shock, including the effects on inflation, GDP, growth and employment.
In other words, macroeconomic modelling is designed to test a range of scenarios, such as what happens if introducing GST reduces spending by more than £700,000.
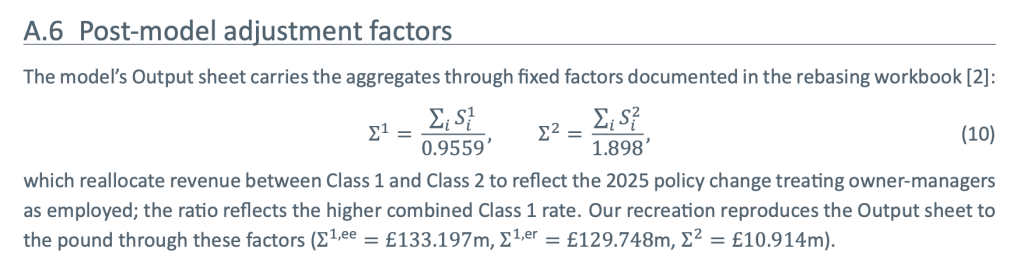
Dorey’s report does contain far more information than we’ve had before about the methodology the modelling uses.
The report confirms that Guernsey’s GST calculation is a full-population microsimulation, but it doesn’t describe a separate macroeconomic model being run on top of it.
To bridge that gap, Dorey ran its own separate macroeconomic analysis as part of the audit, to stress-test how tax react to economic swings.
But while the auditor brought its own macroeconomic tools to the check, P&R’s core tax model remains a static one.
The report uses national-accounts figures and other macroeconomic benchmarks to sense-check the GST estimate, and it considers the effects of things such as households spending more after income-tax cuts.
P&R’s household calculation applies a relatively modest behavioural adjustment afterwards, based on price elasticities.
Dorey says that reduces estimated GST revenue by less than £1m.
But that’s not the same thing as a full macroeconomic model from P&R of the knock-on effects of GST across the economy.
That distinction matters because Dorey explicitly says future revenues will differ because the economy, behaviour and compliance are unknown.
So the independent report gives P&R’s microsimulation a strong tick.
But P&R does not appear to have used macroeconomic modelling to answer the bigger question: what happens to the wider Guernsey economy after GST is introduced?
6. More than 10% of people’s income is estimated
The report also tackles one of the more eyebrow-raising parts of the modelling: what happens when the States don’t have a recorded income figure for someone.
Around 12% of income wasn’t recorded in the database, so it had to be estimated.
However, Dorey says the States’ estimate was sound.
The States used an algorithm called ‘MissForest’, which was developed for biological research, to fill those gaps using information about similar people.
Dorey tested what would happen if every one of those estimates was wrong by 20%.
The answer? The household GST figure would move by just 1.3% either way.
So the review did not find evidence that the income-estimation process was secretly driving the GST figure off a cliff.
That doesn’t mean every estimated income is right.
It means Dorey’s stress test suggests the overall GST figure is relatively insensitive to even a substantial error in those estimates.
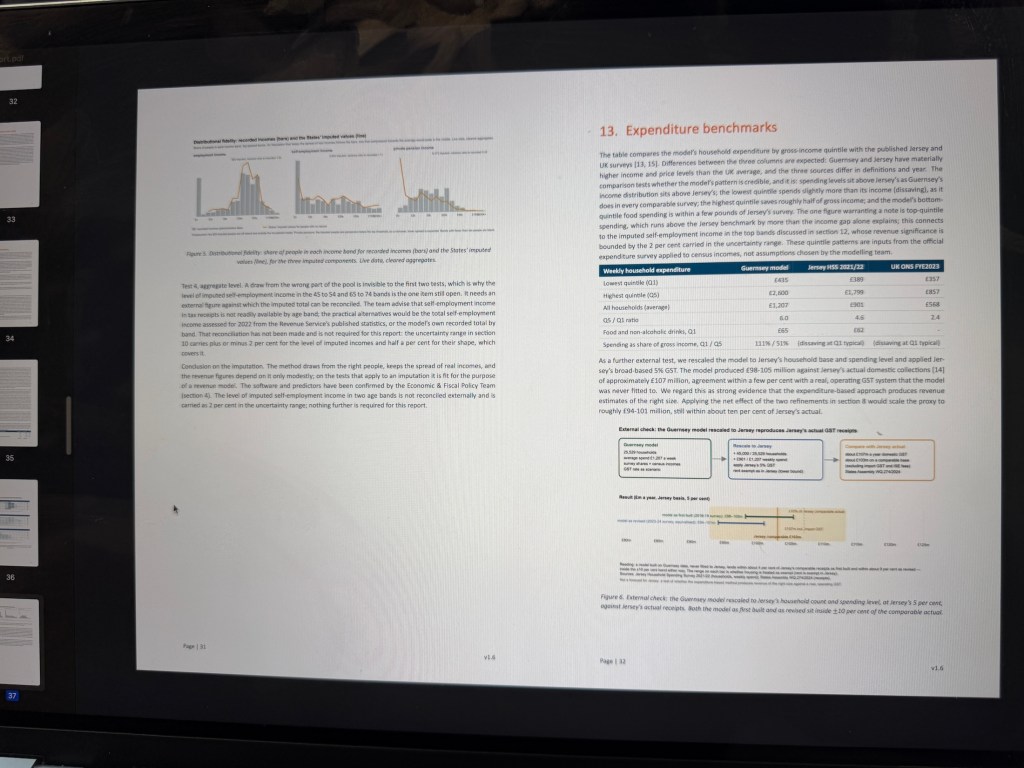
7. Dorey put Guernsey’s model into Jersey – and it came within 10%
And finally, Dorey did something interesting.
It took Guernsey’s model and effectively gave it a Jersey population and spending profile – though this was based on aggregate figures, rather than the detailed and sensitive data it was using here.
It then compared the resulting estimate with Jersey’s real-world GST receipts.
The model came up with a range of £94m to £105m.
Jersey’s actual domestic GST collections are about £107m a year, so the Guernsey model landed within about 10% of the real-world figure.

Dorey says that is a good result given the differences between the islands, including Jersey’s broader tax base and different spending patterns.
It is not proof that Guernsey will collect exactly what its model predicts, but they argue it is a useful reality check.
So, is P&R’s tax model right?
On the narrow set of questions Dorey was asked to answer, the answer is broadly ‘yes’.
The firm says the calculations are correct, the core assumptions are reasonable, and the final revenue estimates are fair.
However, P&R has constantly defended the modelling as irrefutable.
That’s not quite the story Dorey’s report tells.
Of 17 areas Dorey was asked to look at, five were either ‘amber’ or ‘red’. That’s not bad, but it’s not perfect.
The modelling even – somewhat optimistically – assumed GST would be collected in full.
As Dorey pointed out: “No tax is collected in full.
“A normal collection gap of 3 to 5 percent should be anticipated, which is about £1million to £2million.”
And there is a fairly chunky difference between the original figures and where the latest numbers have landed.
- Household GST has fallen from £41m to £38.3m – and Dorey now says that could be as low as £33.5m.
- Visitor GST has fallen from £4.7m to £3.5m.
- The overall GST headline has therefore fallen from about £57m to £53m.
- Then there is the £700,000 reduction in spending.
- And the report’s red warning over another £1m to £2m that may never be collected.
So the machinery may be impressively sophisticated.
The calculations may contain no mistakes.
But with the amount GST could raise already downgraded, many will wonder how much margin for error is left.
The real question for deputies, though, is not whether the maths works on paper, but how much actual cash will actually land in the States’ coffers when real life takes over and what the knock-on economic consequences will be.
If P&R’s tax package gets voted through, time will tell.
